TokenScope v0.2: Tokenizer Inspection as Evaluation Infrastructure
Why TokenScope matters for SRE-Zero, what shipped in v0.1.0 and v0.2.0, and how tokenizer inspection becomes part of reliable agent evaluation.
TokenScope v0.2: Tokenizer Inspection as Evaluation Infrastructure
I released TokenScope v0.2.0, the second public release of my offline terminal tokenizer explorer.
Repository: github.com/DevaanshPathak/tokenscope
Releases: github.com/DevaanshPathak/tokenscope/releases
Release links:
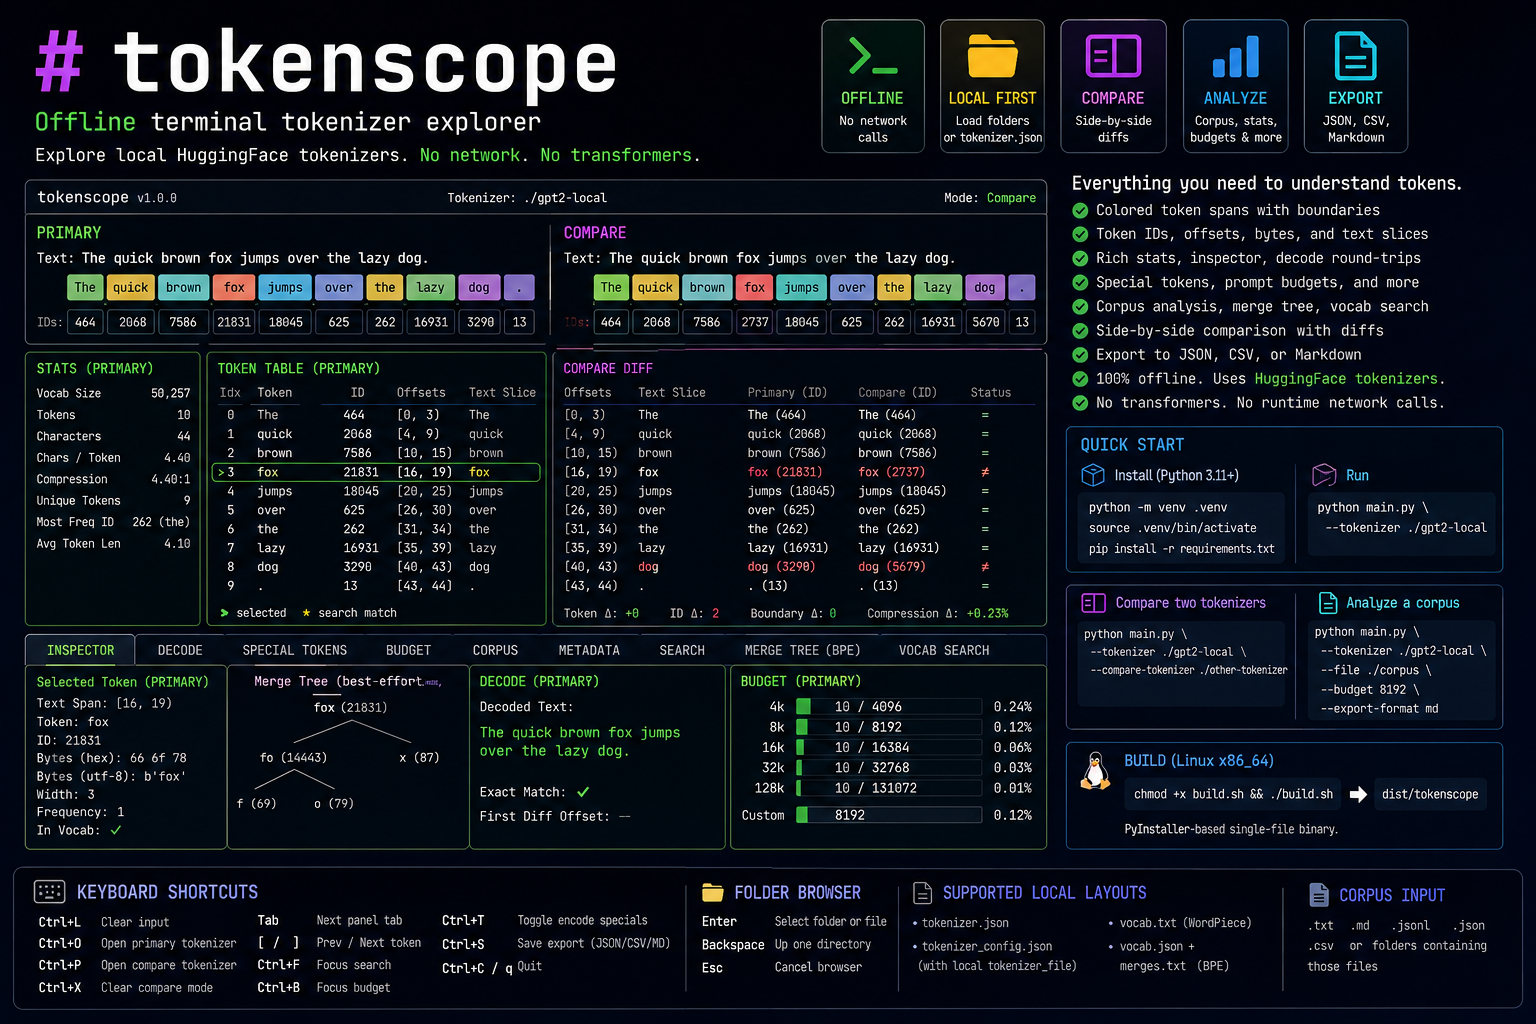
The short description is simple: TokenScope is a terminal tool for loading, inspecting, comparing, benchmarking, and exporting tokenizer behavior.
The longer reason I care about it is more research-facing. Tokenization is not just preprocessing. For agent evaluation, tokenization affects budgets, truncation, prompt packing, tool-output visibility, cost, replay stability, and sometimes the apparent behavior of the model itself. If I want SRE-Zero to be a serious environment-grounded benchmark for incident-response agents, I need tooling that makes the prompt layer inspectable too.
SRE-Zero evaluates agents that inspect logs, metrics, traces, service state, config, and dependency health. Those observations eventually become text placed into a model context. That means a benchmark run is shaped not only by the environment and the policy loop, but also by which tokenizer converts evidence into model input.
TokenScope is my answer to that layer of the stack.
Why tokenizer tooling belongs next to SRE-Zero
SRE-Zero is about reliable tool-using agents in simulated incident-response workflows. The central questions are operational:
- Did the agent gather the right evidence?
- Did it diagnose the actual root cause?
- Did it choose the minimal safe remediation?
- Did it know when the incident was resolved?
- Did it avoid distractors and invalid actions?
Those questions sound independent from tokenization, but they are not.
An incident-response agent often sees a growing transcript: system prompt, task specification, prior observations, tool calls, log snippets, metric summaries, failed actions, remediation candidates, and final-answer instructions. If that transcript crosses a context threshold or gets packed poorly, the agent may lose the one line that identifies the root cause. If two models tokenize the same log line differently, they may experience different budget pressure. If a benchmark compares agents across models without recording tokenizer behavior, part of the evaluation is hidden.
That hidden part matters because SRE-Zero is designed to separate intermediate behavior from final resolution. The benchmark already tracks evidence coverage, invalid actions, root-cause identification, correct fix selection, premature resolution, wrong remediation, and step-budget exhaustion. TokenScope helps inspect the prompt-side mechanics behind those outcomes.
For example:
- A task may fail because the agent did not inspect the right tool.
- It may fail because it inspected the tool but the observation was truncated.
- It may fail because a long log line consumed more context than expected.
- It may fail because a tokenizer split identifiers, paths, stack traces, or config keys in a surprising way.
- It may fail because a prompt-packing strategy preserved early context and dropped late evidence.
Those are different failure modes. A serious evaluation harness should not flatten them into "the model failed".
The practical problem: context is an operational budget
In normal app development, token counts are often treated as a cost estimate. In agent evaluation, token counts are closer to an operational resource.
An SRE-Zero trajectory has a budget in steps, but it also has a budget in context. The agent might have eight steps to resolve an incident, and each step may add observations. Logs can be noisy. Metrics can be summarized or verbose. Tool outputs can be compact or sprawling. A single bad observation format can push critical evidence out of the active prompt.
That makes tokenizer inspection part of benchmark engineering:
- Budget accounting: measure how close a trajectory is to context limits.
- Prompt packing: decide whether to keep head, tail, head+tail, summaries, or selected evidence.
- Model comparison: understand when two models are seeing materially different token budgets.
- Regression testing: catch prompt format changes that silently increase token count.
- Reproducibility: export token IDs, offsets, spans, and reports for later analysis.
This is why I think TokenScope and SRE-Zero fit together. SRE-Zero creates environment-grounded trajectories. TokenScope makes the text interface to the model observable.
What shipped in v0.1.0
The first public release, v0.1.0, was the foundation release. It established TokenScope as an offline terminal tokenizer explorer for local HuggingFace tokenizer files.
The core feature was local tokenizer loading. TokenScope could load tokenizer folders, direct tokenizer.json files, WordPiece vocab files, and BPE vocab and merge files. That was the minimum viable foundation because I wanted the tool to work with local artifacts, not only hosted model names.
v0.1.0 also added interactive inspection:
- colored token spans
- token IDs
- offsets
- UTF-8 byte views
- statistics
- selected-token inspection
- decode round-trip checks
- special-token views
- prompt budget views
- BPE merge-tree inspection
The key design goal was not just "count tokens". Counting tokens is useful, but insufficient. I wanted to see how text became tokens, which spans corresponded to which IDs, whether decode was stable, and how special tokens affected the result.
v0.1.0 also introduced side-by-side compare mode. That matters because tokenizer behavior becomes easier to understand when two tokenizers encode the same input side by side. The compare view reports aligned diff rows, compare metrics, corpus comparison, and tokenizer metadata.
For benchmark work, the local corpus and batch analyzers were important. They allowed TokenScope to inspect .txt, .md, .jsonl, .json, and .csv inputs. That maps naturally onto evaluation artifacts: prompt files, task definitions, run logs, generated reports, and input corpora.
The first release also included project save/load, tokenizer diffing, prompt packing simulation, regression suites, Unicode inspection, RAG chunk analysis, token-count distributions, cost estimates, tokenizer repair suggestions, and exports to JSON, CSV, Markdown, and HTML.
Finally, v0.1.0 added headless analyze mode for scripts and CI checks. That is the bridge from interactive exploration to infrastructure.
Example:
python main.py analyze --tokenizer ./gpt2-local --input-file prompt.txt --budget 8192 --fail-on-budget
That command is small, but the idea is large: a tokenizer check can become a gate in the same way tests, lint, and typecheck are gates.
What v0.2.0 adds
The second public release, v0.2.0, moves TokenScope from local inspection toward practical workflow integration.
The headline additions are:
- HuggingFace Hub tokenizer loading
- speed benchmarking
- budget threshold alerts
- clipboard utilities
- configuration file support
- stdin pipe mode
Each of those features matters for a slightly different reason.
HuggingFace Hub tokenizer loading
v0.1.0 focused on local files. That was deliberate because offline reproducibility matters. But public model workflows often start from model IDs, not local folders.
v0.2.0 adds on-demand Hub loading:
python main.py --hub meta-llama/Llama-3.1-8B
The TUI can also load a model ID directly through the folder browser flow. This makes it easier to compare a local tokenizer with a public model tokenizer, or quickly inspect a candidate model before adding it to an SRE-Zero baseline run.
For SRE-Zero, this matters because baseline runs often compare model families. If I test OpenAI-compatible hosted models, open-source hosted models, local models, and smaller offline agents, I need to understand the tokenizer boundary around each one. Hub loading lowers the friction of that inspection.
Speed benchmarking
v0.2.0 adds a Benchmark tab for tokenization throughput. It reports tokens per second and characters per second for primary and compare tokenizers.
This is not only a performance toy. In evaluation infrastructure, tokenization can become a real cost when running large sweeps, batch prompt analyses, regression suites, or report generation. If a tokenizer is slow enough, it can affect the ergonomics of the harness and the speed of local experiments.
For SRE-Zero, speed benchmarking helps answer practical questions:
- Can this tokenizer be used in a preflight check for every task?
- Is tokenizer comparison cheap enough to run before each managed sweep?
- Is a batch of prompt artifacts small enough for quick local inspection?
- Does a model choice introduce unexpected preprocessing overhead?
Budget threshold alerts
TokenScope v0.2.0 adds an ambient budget badge in the TUI header and a dedicated row in the stats panel. The threshold colors are:
- green below 80%
- yellow from 80% to 95%
- red above 95%
- bold red above 100%
This is one of the most SRE-Zero-relevant changes in the release.
Agent failures are often gradual. A trajectory does not suddenly become bad only when it exceeds a hard limit. It becomes risky as it approaches a limit. A prompt at 79% of budget and a prompt at 97% of budget are both technically valid, but they imply different operational risk.
In incident-response agents, that risk is easy to miss. The agent may still run, but it may have no room left for the next tool observation. It may preserve old context while dropping the new evidence. It may compress logs aggressively. It may be forced into a premature final answer because the prompt cannot grow safely.
Budget alerts make that visible.
Clipboard integration
v0.2.0 adds Ctrl+Y to copy space-separated primary token IDs to the system clipboard.
This is small but useful. Token IDs are often the lowest-level artifact needed for regression cases, bug reports, and tokenizer comparisons. If a strange span appears in a log line, being able to copy IDs immediately makes it easier to move from interactive debugging into a test case.
For SRE-Zero, I expect this to be useful when debugging odd behavior around service names, paths, config keys, stack traces, Unicode characters, and punctuation-heavy log snippets.
Configuration files
v0.2.0 adds .tokenscoperc and tokenscope.json support. TokenScope searches the current working directory first and then the user home directory. It also adds:
python main.py init-config
This makes TokenScope easier to use as a repeatable workflow tool instead of a one-off terminal session.
For example, a SRE-Zero workspace can have defaults for:
- tokenizer path
- Hub model ID
- budget
- export format
- special-token behavior
That gives the project a stable tokenizer-inspection profile. When the environment changes, the config file becomes a visible artifact rather than a hidden CLI habit.
stdin pipe mode
v0.2.0 improves headless analyze so it can read piped text from standard input.
Example:
cat incident_prompt.txt | python main.py analyze --tokenizer ./gpt2-local --stdin --export report.json
This is the release feature that most clearly turns TokenScope into infrastructure. Pipelines can now stream generated prompts, task descriptions, or log snippets into TokenScope without writing glue files everywhere.
For SRE-Zero, that suggests a clean future workflow:
python export_prompt.py --task cache_crash --agent react \
  | python D:/tokenscope/main.py analyze --tokenizer ./gpt2-local --stdin --budget 8192 --export prompt-budget.json
That kind of command lets a benchmark harness treat tokenizer checks as part of run preparation.
TokenScope as a prompt observability tool
The phrase "prompt observability" sounds abstract, but the concrete need is straightforward.
When an agent fails, I want to answer:
- What exactly did the model see?
- How many tokens did each part consume?
- Which observation pushed the prompt near the limit?
- Did a tokenizer split operational identifiers in a surprising way?
- Did special-token handling change the effective prompt?
- Did a packing strategy preserve the right evidence?
- Can I reproduce the same tokenization later?
SRE-Zero already gives me structured run artifacts. It records agent trajectories, task outcomes, partial-credit metrics, command logs, and JSON summaries. TokenScope complements that by inspecting the model-input surface.
A good SRE-Zero debugging loop might look like this:
- Run a managed baseline sweep.
- Find tasks with evidence coverage but no final success.
- Extract the prompt state before the wrong remediation or premature resolution.
- Use TokenScope to inspect token count, spans, offsets, Unicode, and budget use.
- Compare tokenizers for the candidate models.
- Export a report that can be attached to the run artifact.
- Decide whether the failure is diagnosis, remediation, context pressure, or prompt packing.
The important point is that TokenScope does not replace the benchmark. It makes one hidden part of the benchmark easier to inspect.
Why model comparison needs tokenizer comparison
SRE-Zero baseline posts often compare agent-control styles: random, scripted, prompting, ReAct, guided control, and open-source model variants. Those comparisons are useful, but model comparison can be misleading if the prompt surface differs silently.
Two tokenizers may disagree on:
- service names
- snake_case identifiers
- file paths
- URLs
- stack traces
- metric names
- timestamps
- YAML and JSON fragments
- Unicode markers
- whitespace
Those differences can affect token count and span boundaries. If a model has a larger or smaller effective budget for the same observation, it is not seeing exactly the same operational situation.
TokenScope compare mode makes these differences inspectable. It can show the same incident prompt under two tokenizers, align the spans, and report token-count deltas. That gives SRE-Zero a cleaner way to discuss model results. Instead of pretending the prompt layer is identical, the benchmark can record how the prompt was represented.
That is especially important when results are close. If two agents differ by a small success margin, and one tokenizer consistently consumes more context for log-heavy tasks, that may matter.
The offline-first choice
TokenScope remains offline-first. No runtime network calls happen unless Hub loading is explicitly requested through --hub, --compare-hub, Load from Hub, config defaults, or a workflow profile that uses a Hub model.
That matters because benchmark artifacts often include prompts, logs, generated incident state, or private corpora. Even when those artifacts are synthetic, I still prefer local-first tooling for reproducibility and safety.
The design is:
- local tokenizer files by default
- explicit Hub downloads when requested
- exportable reports
- repeatable configs
- CI-friendly headless mode
That matches the way I want SRE-Zero tooling to evolve. Exploration can be interactive, but published claims should be reproducible.
Validation and release discipline
Both public releases used the same basic validation pattern:
python -m compileall .
python -m unittest discover -v
v0.1.0 also included binary smoke tests for Windows and Linux. v0.2.0 added headless stdin analysis integration verification.
The release assets are attached on GitHub. v0.2.0 includes Linux, macOS arm64, and Windows x86_64 builds, plus source archives.
The binaries are not the research result. They are infrastructure. But infrastructure matters because it makes the tool easier to run from the same machines where experiments happen.
What I want TokenScope to become
The current direction is clear:
- inspect tokenizer behavior interactively
- compare model tokenizers side by side
- run prompt-budget checks in scripts
- export evidence for run artifacts
- use configs and profiles for repeatability
- connect tokenization analysis to agent evaluation
For SRE-Zero, I eventually want TokenScope-style reports to sit next to evaluation JSON, logs, plots, and command records. When a blog post reports that an agent failed by premature resolution or wrong remediation, I want to know whether the prompt state was healthy. When a model does better on evidence coverage but worse on final success, I want to check whether the context was full of redundant evidence. When a prompt format changes, I want a regression check to catch the token-budget shift before it contaminates a comparison.
That is the broader reason TokenScope exists.
It is a tokenizer explorer, but it is also a reliability tool. Reliable agent evaluation needs visibility into the environment, the trajectory, the tools, the scoring, and the prompt boundary. SRE-Zero covers the environment side. TokenScope covers the tokenizer side.
Together, they make one more part of the agent stack inspectable.