Managing Long SRE-Zero Baseline Runs with a Terminal UI
Why SRE-Zero now has a local terminal UI for creating, pausing, resuming, monitoring, and organizing long model-evaluation sweeps.
Managing Long SRE-Zero Baseline Runs with a Terminal UI
The last few weeks of working on SRE-Zero have made one thing clear: agent benchmarks are not just about task design and scoring. They also need practical run management.
SRE-Zero is a simulated incident-response benchmark for reliable tool-using agents. The environment is deterministic and safe: agents inspect simulated logs, metrics, service status, and configuration, then apply minimal simulated remediations under a step budget.
That part is the benchmark.
But running the benchmark repeatedly across many models is a systems problem.
When a run contains 40 tasks, multiple baselines, provider-backed LLM calls, rate limits, transient errors, and a small daily API budget, a simple one-shot command is not enough. I needed a way to create a run, execute one model at a time, pause safely, resume later, inspect logs, and keep all JSON outputs organized.
That is why SRE-Zero now has a local terminal UI for managed baseline runs.
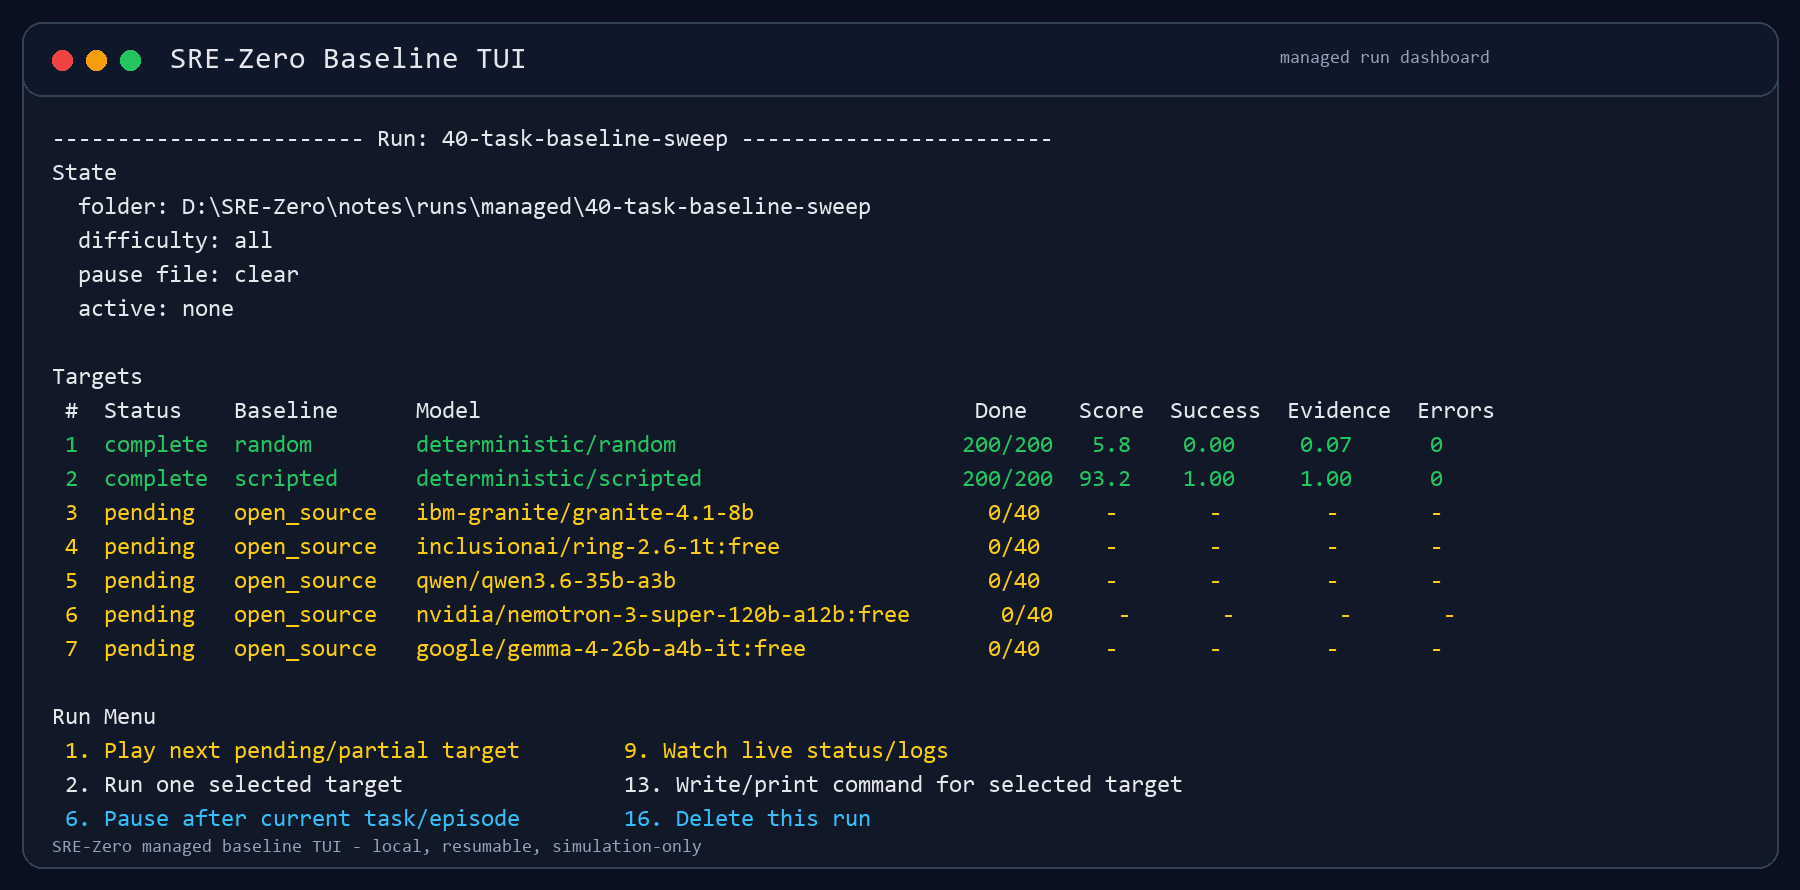
The managed-run dashboard keeps target state, partial progress, baseline scores, and run controls in one local terminal view.
Supporting artifact
Why add a TUI?
The immediate problem was not model quality. It was benchmark operation.
For deterministic baselines, running the full suite is cheap and fast:
- random baseline
- scripted expert baseline
For API-backed baselines, every run has more failure modes:
- provider rate limits
- intermittent request errors
- slow responses
- retry backoff
- model endpoints that are temporarily unavailable
- long-running sweeps that need to be paused across laptop sessions
I wanted the benchmark harness to support this reality without turning the repo into a full web application.
So the design constraint was simple:
Add enough run management to make evaluations usable, but keep it local, plain, inspectable, and research-oriented.
What the TUI does
The new TUI is launched with:
python eval/run_tui.py
It creates managed runs under:
notes/runs/managed/
Each managed run has its own folder containing:
- run configuration
- per-target output JSON
- per-target summaries
- console logs
- runner logs
- generated PowerShell commands
- a run-local pause flag
The TUI currently supports:
- creating named benchmark runs
- selecting baselines
- selecting models from
notes/available_models.md - adding models after a run is created
- removing targets from a run
- running one target at a time
- exporting queue scripts
- watching live status and logs
- pausing cooperatively
- stopping immediately when needed
- clearing pause flags
- rebuilding combined summaries
- deleting target artifacts
- deleting full managed runs
This is not a web app. It is just enough local tooling to make long research runs less fragile.
Keyboard model selection
The first version of model selection was too clumsy. It used typed row numbers and ranges, which worked, but it was easy to misunderstand whether a selected row was being added or toggled.
The model picker now behaves more like a checklist:
- Up/Down moves through the list
- Space toggles the highlighted model
- Enter accepts the selection
- Left/Right changes pages
/filters modelsfclears the filteraselects visible rowsuclears visible rowscclears all selected rowsdresets to defaultsmadds manual model slugs:opens typed command mode
Selected rows render as:
[x]
Unselected rows render as:
[]
The old typed mode still exists because it is useful for scripted terminals and quick bulk edits:
![SRE-Zero TUI model checklist showing selected models as [x] and unselected models as empty brackets.](/blog-assets/6/assets/tui-model-checklist.png)
select 1-5
drop 2,4
1-3
The difference is that select forces rows on, drop forces rows off, and a
bare range toggles.
Pause means "after the current task"
One important detail is pause semantics.
If a model is running task 17 out of 40 and I request a cooperative pause, the runner should not corrupt the current episode. It should:
- finish task 17
- write the checkpoint JSON
- stop before task 18
- resume later from task 18
That is the behavior implemented in the evaluation runner.
The pause flag is checked before starting each task/episode. After each completed task/episode, the runner writes a partial JSON checkpoint. If the pause flag is present before the next task/episode starts, the run exits cleanly and remains resumable.
This also means cooperative pause is not an instant interrupt. If the current task is waiting on a model request, retry sleep, or provider timeout, it will finish that in-flight operation first.
For immediate interruption, the TUI has a separate pause-and-stop control.
Live monitoring
The TUI now opens a live monitor when a target starts.
The live view refreshes:
- target status
- completed task counts
- current score if available
- evidence coverage if available
- error counts
- console logs
- runner logs
The live controls are:
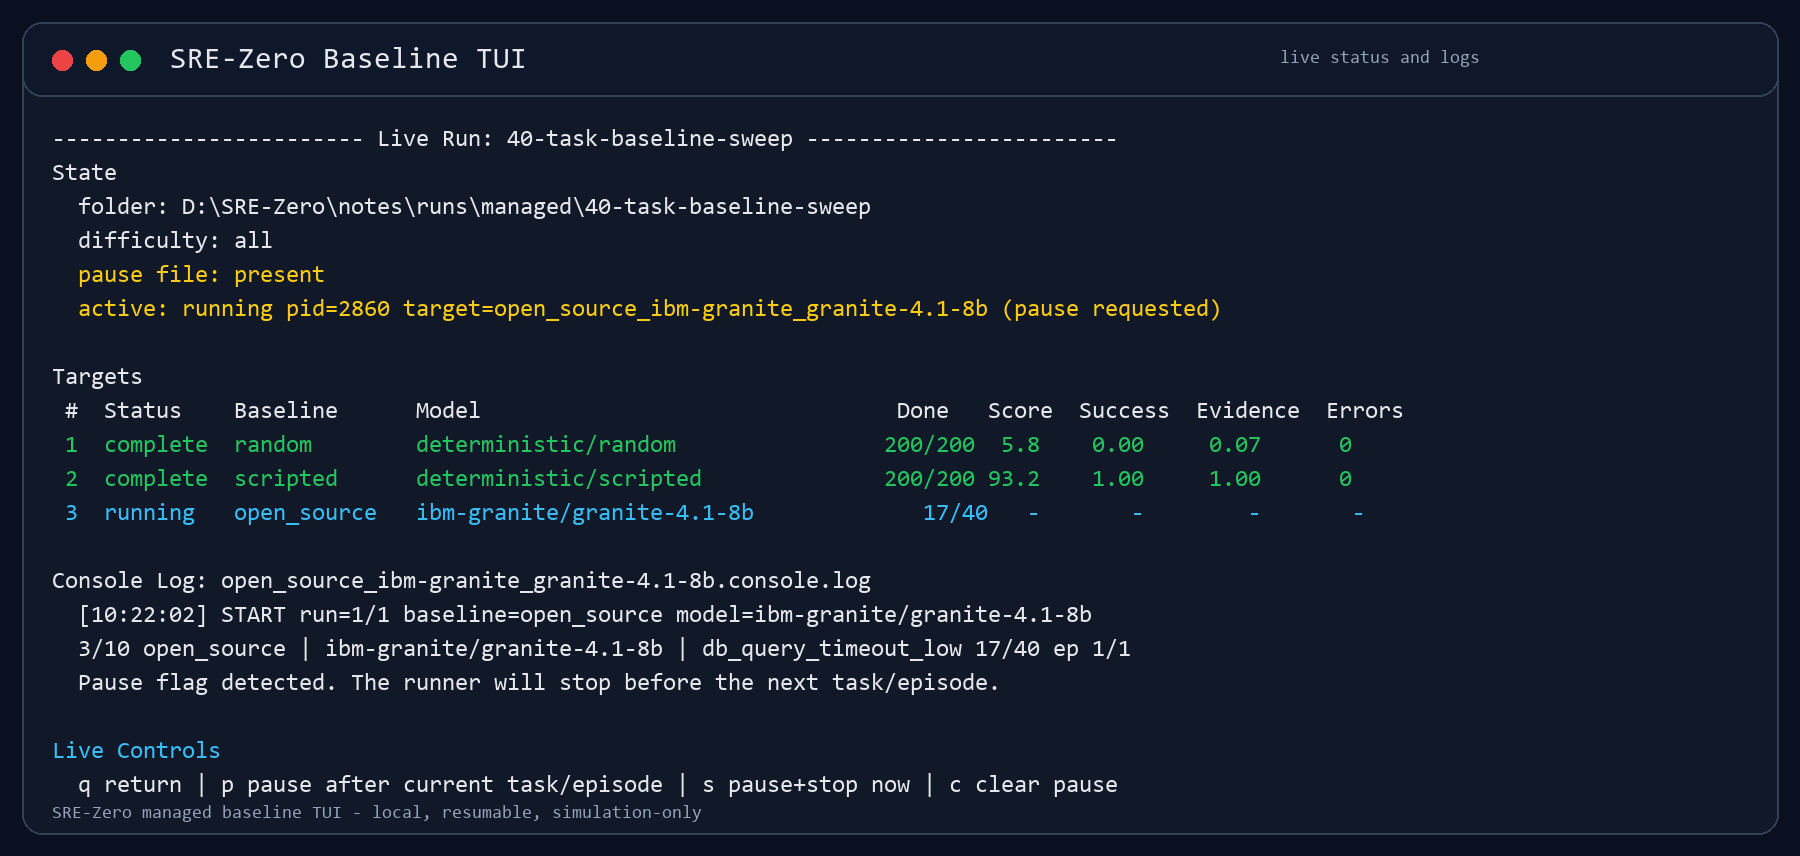
p  cooperative pause after current task/episode
s  pause and stop active process now
c  clear pause flag
q  return to the run menu
This makes the distinction explicit:
pis safe and resumablesis immediate and should be used when I need to shut down the machine or stop burning provider budget
Both paths preserve the run folder and any partial JSON that has already been written.
Why this matters for benchmark reliability
This TUI is not part of the core SRE-Zero benchmark score. It does not change the tasks, services, action space, rewards, or metrics.
But it matters for benchmark practice.
Without run management, it is too easy to lose track of:
- which model was run
- which tasks completed
- which outputs are partial
- which provider errors happened
- whether a result reflects model behavior or provider instability
- how to resume without rerunning completed tasks
The managed-run structure makes those details explicit.
Each target gets its own JSON and logs. Completed targets can be skipped on resume. Partial targets can continue from existing records. Runs can be inspected before turning them into plots, tables, or blog posts.
That is especially important because I am still treating SRE-Zero results as preliminary. The goal right now is to validate the benchmark design and tooling, not to publish final model rankings.
What this enables next
The TUI makes it easier to run evaluations in smaller, budget-aware batches.
For example, I can create one managed run with:
- random baseline
- scripted expert baseline
- open-source model targets
- frontier model targets
Then I can execute only one target today, pause cleanly, and continue tomorrow. If a provider becomes unstable, I can stop that target without deleting the whole run. If I need to add a model later, I can add it to the same run folder.
This should make future result posts more reproducible:
- the command is stored
- the output JSON is stored
- the logs are stored
- the target summary is stored
- the combined summary can be rebuilt
That is a small but important step toward a benchmark that can support public technical reports instead of one-off screenshots.
Current status
SRE-Zero now has:
- 40 deterministic incident-response tasks
- 5 simulated services
- structured actions
- partial-credit rewards
- random and scripted baselines
- LLM baseline adapters
- provider retry and cooldown controls
- resumable evaluation JSONs
- a managed-run terminal UI
The next step is to use this harness to collect cleaner model runs under a more stable provider setup.
I am deliberately not treating every early sweep as a leaderboard. For now, the more important result is that the benchmark infrastructure is becoming reliable enough to support careful comparisons later.